Certification of our Work
At Fox Audio Research we know that at the end of the day the way a microphone sounds is what really matters. We also know however that in order to have quality control we need objective ways to evaluate the work we do on your microphone. We want it to be certified.
So to that end we have developed some testing procedures that are performed on your microphone twice.
The first time we test your microphone is when it arrives. We use these tests to establish the base line electrical and acoustic performance of your microphone.
The second time we test your microphone is when we have completed your modifications. This is how you can be sure that we have made a difference to the specifications of your microphone.
We print out and send all these test results back to you with your microphone. This is the Fox Audio Research Certification process.
Electronic Tests
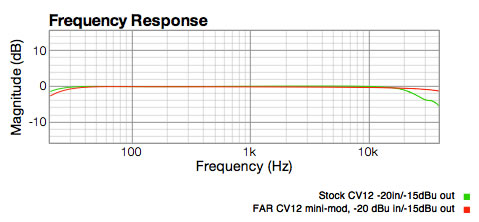
Preamp Frequency Response: 10Hz to 40KHz
measures the electrical frequency response of the preamp inside your microphone.
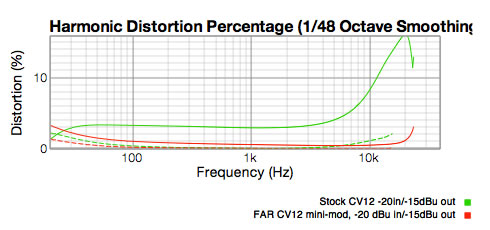
Preamp Harmonic Distortion:
Measures the 2nd Harmonic (solid line below) and 3rd Harmonic electronic distortion (dotted line) of the preamp inside your microphone. Note the difference before and after in this CV-12.
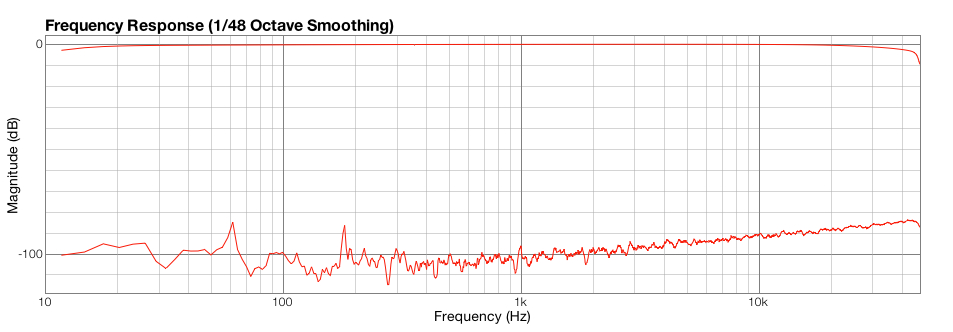
Preamp Noise Floor
We plot the raw noise output of your microphone with the preamp input grounded while it is inside a Faraday cage. With this test you see the preamp's internal noise at all frequencies from 20Hz to 20KHz
Acoustic Tests
Frequency Response
Acoustic Frequency response gives you snapshot of how your microphone "hears". The graph can be understood easily if you imagine it is a graphical presentation of an equalizer; the kind you see in Digital Audio Workstation (DAW) programs like Logic Pro. So in other words the graph is showing you how your microphone kind of "pre-equalizes" all sound that it picks-up.
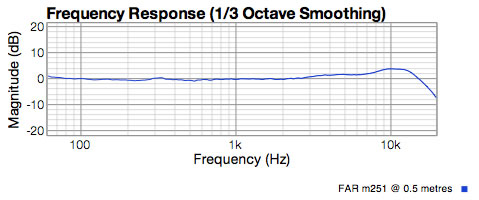
FAR 251 Standard Edition, with CEK 12 capsule response at 0.5 metres, 60Hz to 20kHz
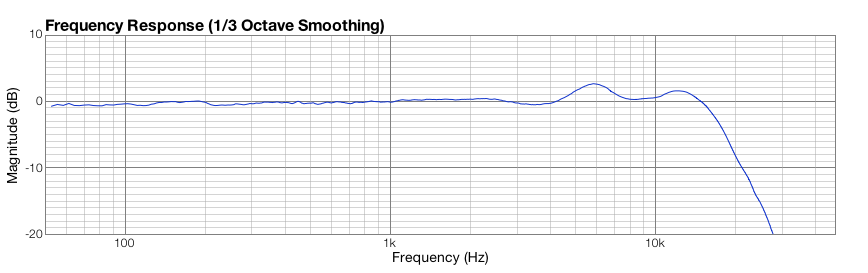
AT4040 response at 0.5 metres showing 40Hz to 40kHz (compare to published graph)
Our acoustic frequency response tests compare your microphone to the Bruel and Kjaer 4135 capsule.
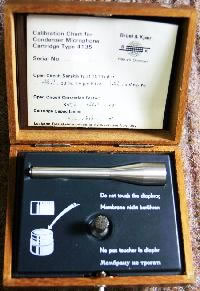
Bruel and Kjaer 4135 specs are here
This is a laboratory grade measurement microphone which has a flat response (+/- 2 dB) from 5 Herz (vibrations per second) to 100,000 Herz.
For audio range testing it has a flat response from 10Hz to 20KHz +0 and -.5dB.
This is not a $50.00 measurement microphone. With this lab grade piece of equipment, we are very confident that the response graph we create gives you an excellent view of your mic's response.
To find out more send us a note at: